With the increased popularity of linac-based stereotactic treatments over the recent years, the need for dedicated patient-specific quality assurance (QA) equipment is also increasing. Among the key distinguishing characteristics of such equipment are high spatial resolution and sampling frequency of the detector array.
The resolution is dictated by the active volume of the detector, or to be more precise, by its point spread function. The width of the point spread function decreases with increasing density of the detector medium, giving solid-state detectors an advantage over their air- or liquid-filled counterparts. In fact, for diode detectors, the width of their point spread function is typically smaller than their physical size.
The sampling frequency of a QA array is represented by the detector spacing and is related to, but distinct from the detector resolution. As stated by the Nyquist-Shannon sampling theorem, a distribution can be fully sampled if the sampling frequency is twice the highest frequency occurring in that distribution. Therefore, the question of adequate detector spacing can be answered by evaluating typical stereotactic dose distributions in the frequency domain and comparing their frequency spectra against the sampling frequency of a QA array. If the sampling frequency is lower than twice the maximum frequency in the dose distribution, the effects can be approximated by applying an anti-aliasing low-pass filter, i.e., discarding the higher-frequency components of the distribution.
Figure 1. a) 2D dose distribution for a spine SBRT delivery. The dose was measured via film dosimetry (0.35x0.35 mm2 pixel size). b) Frequency spectrum along the Y-axis of the 2D Fourier transform of (a). The arrow shows the maximum frequency sampled by SRS MapCHECK. c) Distribution of gamma values for 1%/0.5 mm gamma comparison of filtered and original dose distributions. d) Y-axis profile through the original (orange line) and filtered (blue dots) dose distributions. Larger blue circles correspond to SRS MapCHECK detector positions.
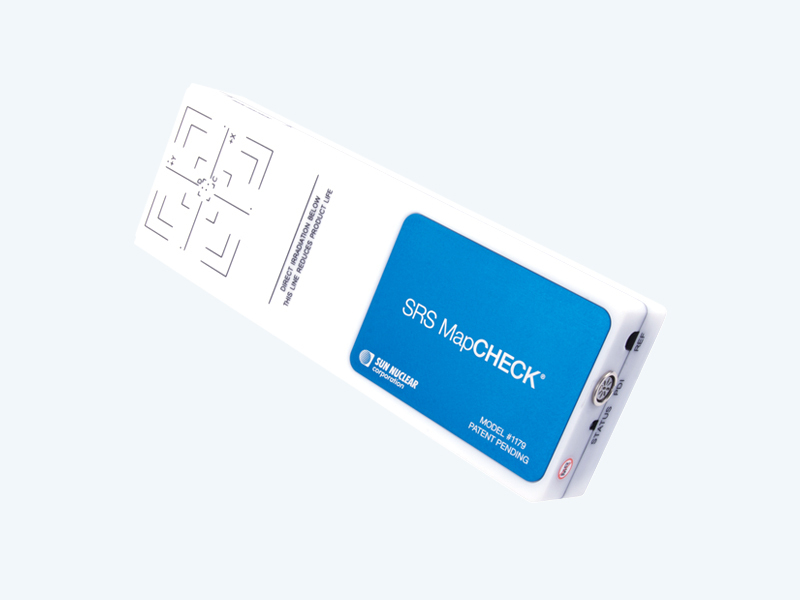
Figure 1 shows an example of such estimate for the Sun Nuclear SRS MapCHECK (2.5 mm detector spacing, 0.47 mm2 active detector area). The figure shows a dose distribution for a spine SBRT treatment. The frequency spectrum (Fig. 1(b)) corresponds to a profile taken along the y-axis (through the isocenter and perpendicular to the plane of gantry rotation). This is the direction of the highest dose gradient and thus represents the upper limit of the frequencies found in this distribution.
SRS MapCHECK’s detector spacing of 2.5 mm allows to sample frequencies up to 0.2 mm-1, or 1/(2*2.5mm). The impact of not sampling the small contributions of frequencies exceeding this limit can be visualized by applying a low-pass filter, converting the 2D frequency spectrum (not shown) back to spatial domain, and comparing it to the original dose distribution. The results of these operations are shown in Figure 1(c) and (d). 2D gamma analysis was used to compare the filtered and original dose distributions with 1% and 0.5 mm dose difference and distance-to-agreement criteria, respectively, and yielded the passing rate of 100%. This example illustrates that SRS MapCHECK’s 2.5 mm detector spacing is sufficient to adequately sample typical stereotactic dose distributions.
About the Author
Lena Tirpak is a Product Physicist at Sun Nuclear, the leader in quality assurance solutions for radiation therapy and diagnostic imaging. Lena supports product research and development and played a key role in the development of the SRS MapCHECK system. She holds a doctorate in solid-state physics and master’s degree in medical physics.
This article was originally published in the European Federation of Organisations for Medical Physics (EFOMP) Spring 2021 Newsletter. Find the full newsletter here.